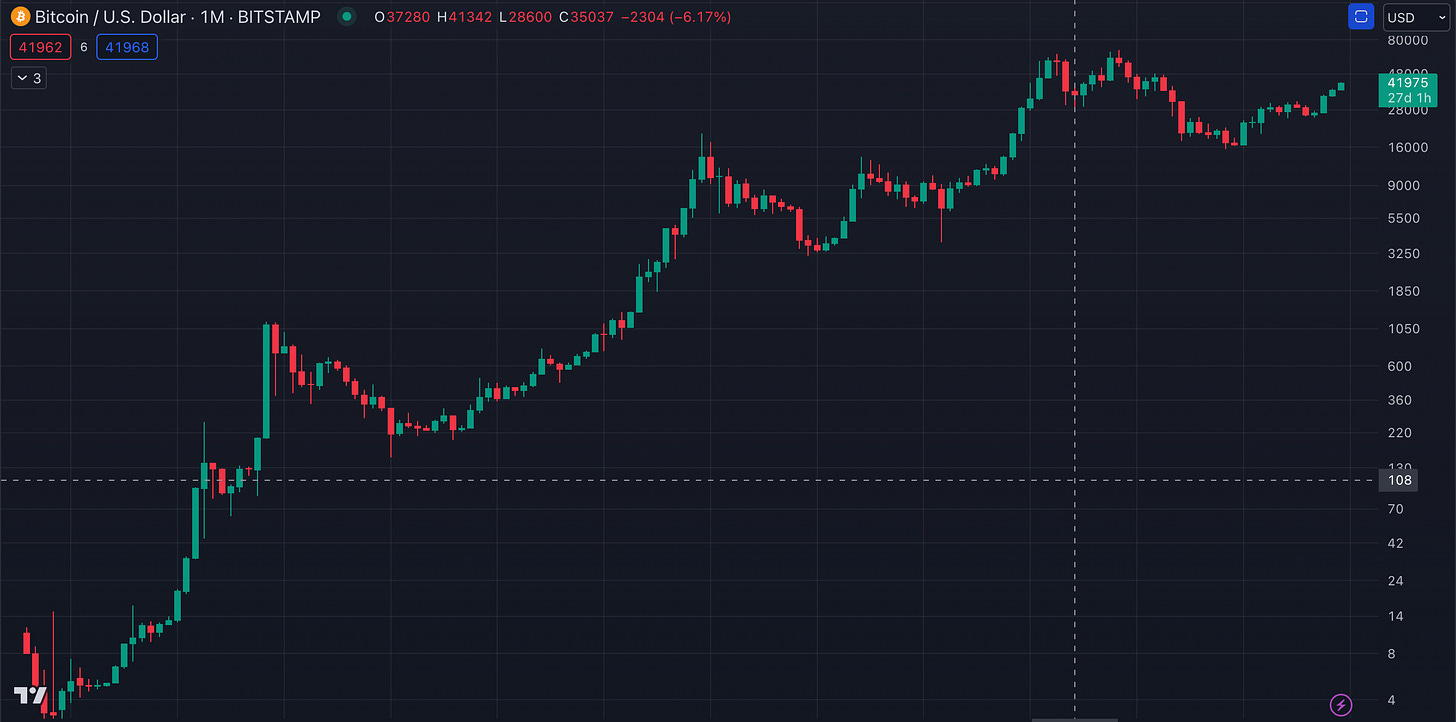
JT's Technical Analysis Lesson 1
Understanding Candlestick Charts for Crypto Trading: A Beginner's Guide
Welcome to the first lesson in our weekly series on technical analysis for cryptocurrency trading! Today, we'll dive into the world of candlestick charts, a fundamental tool in the trader's toolkit. Whether you're new to crypto trading or looking to sharpen your skills, this guide will provide you with a solid foundation in understanding and interpreting candlestick charts.
What are Candlestick Charts?
Candlestick charts originated in Japan over 100 years ago and have become a popular technique for displaying price movements in financial markets, including cryptocurrencies like Bitcoin and Ethereum. Unlike traditional line charts, candlesticks provide more detailed information about market sentiment and potential price movements.
To read the rest of this comprehensive lesson on candlesticks and to get full access to all the forthcoming weekly technical analysis lessons, subscribe now:
Keep reading with a 7-day free trial
Subscribe to JT’s Newsletter to keep reading this post and get 7 days of free access to the full post archives.


